Weekly Market Commentary
February 2nd, 2026
Week in Review…
Economic data released last week suggested mixed growth, with strengthening activity signals contrasting sharply with weaker consumer confidence, persistent producer level inflation, and a Fed meeting that underscored a steady policy stance amid ongoing economic uncertainty.
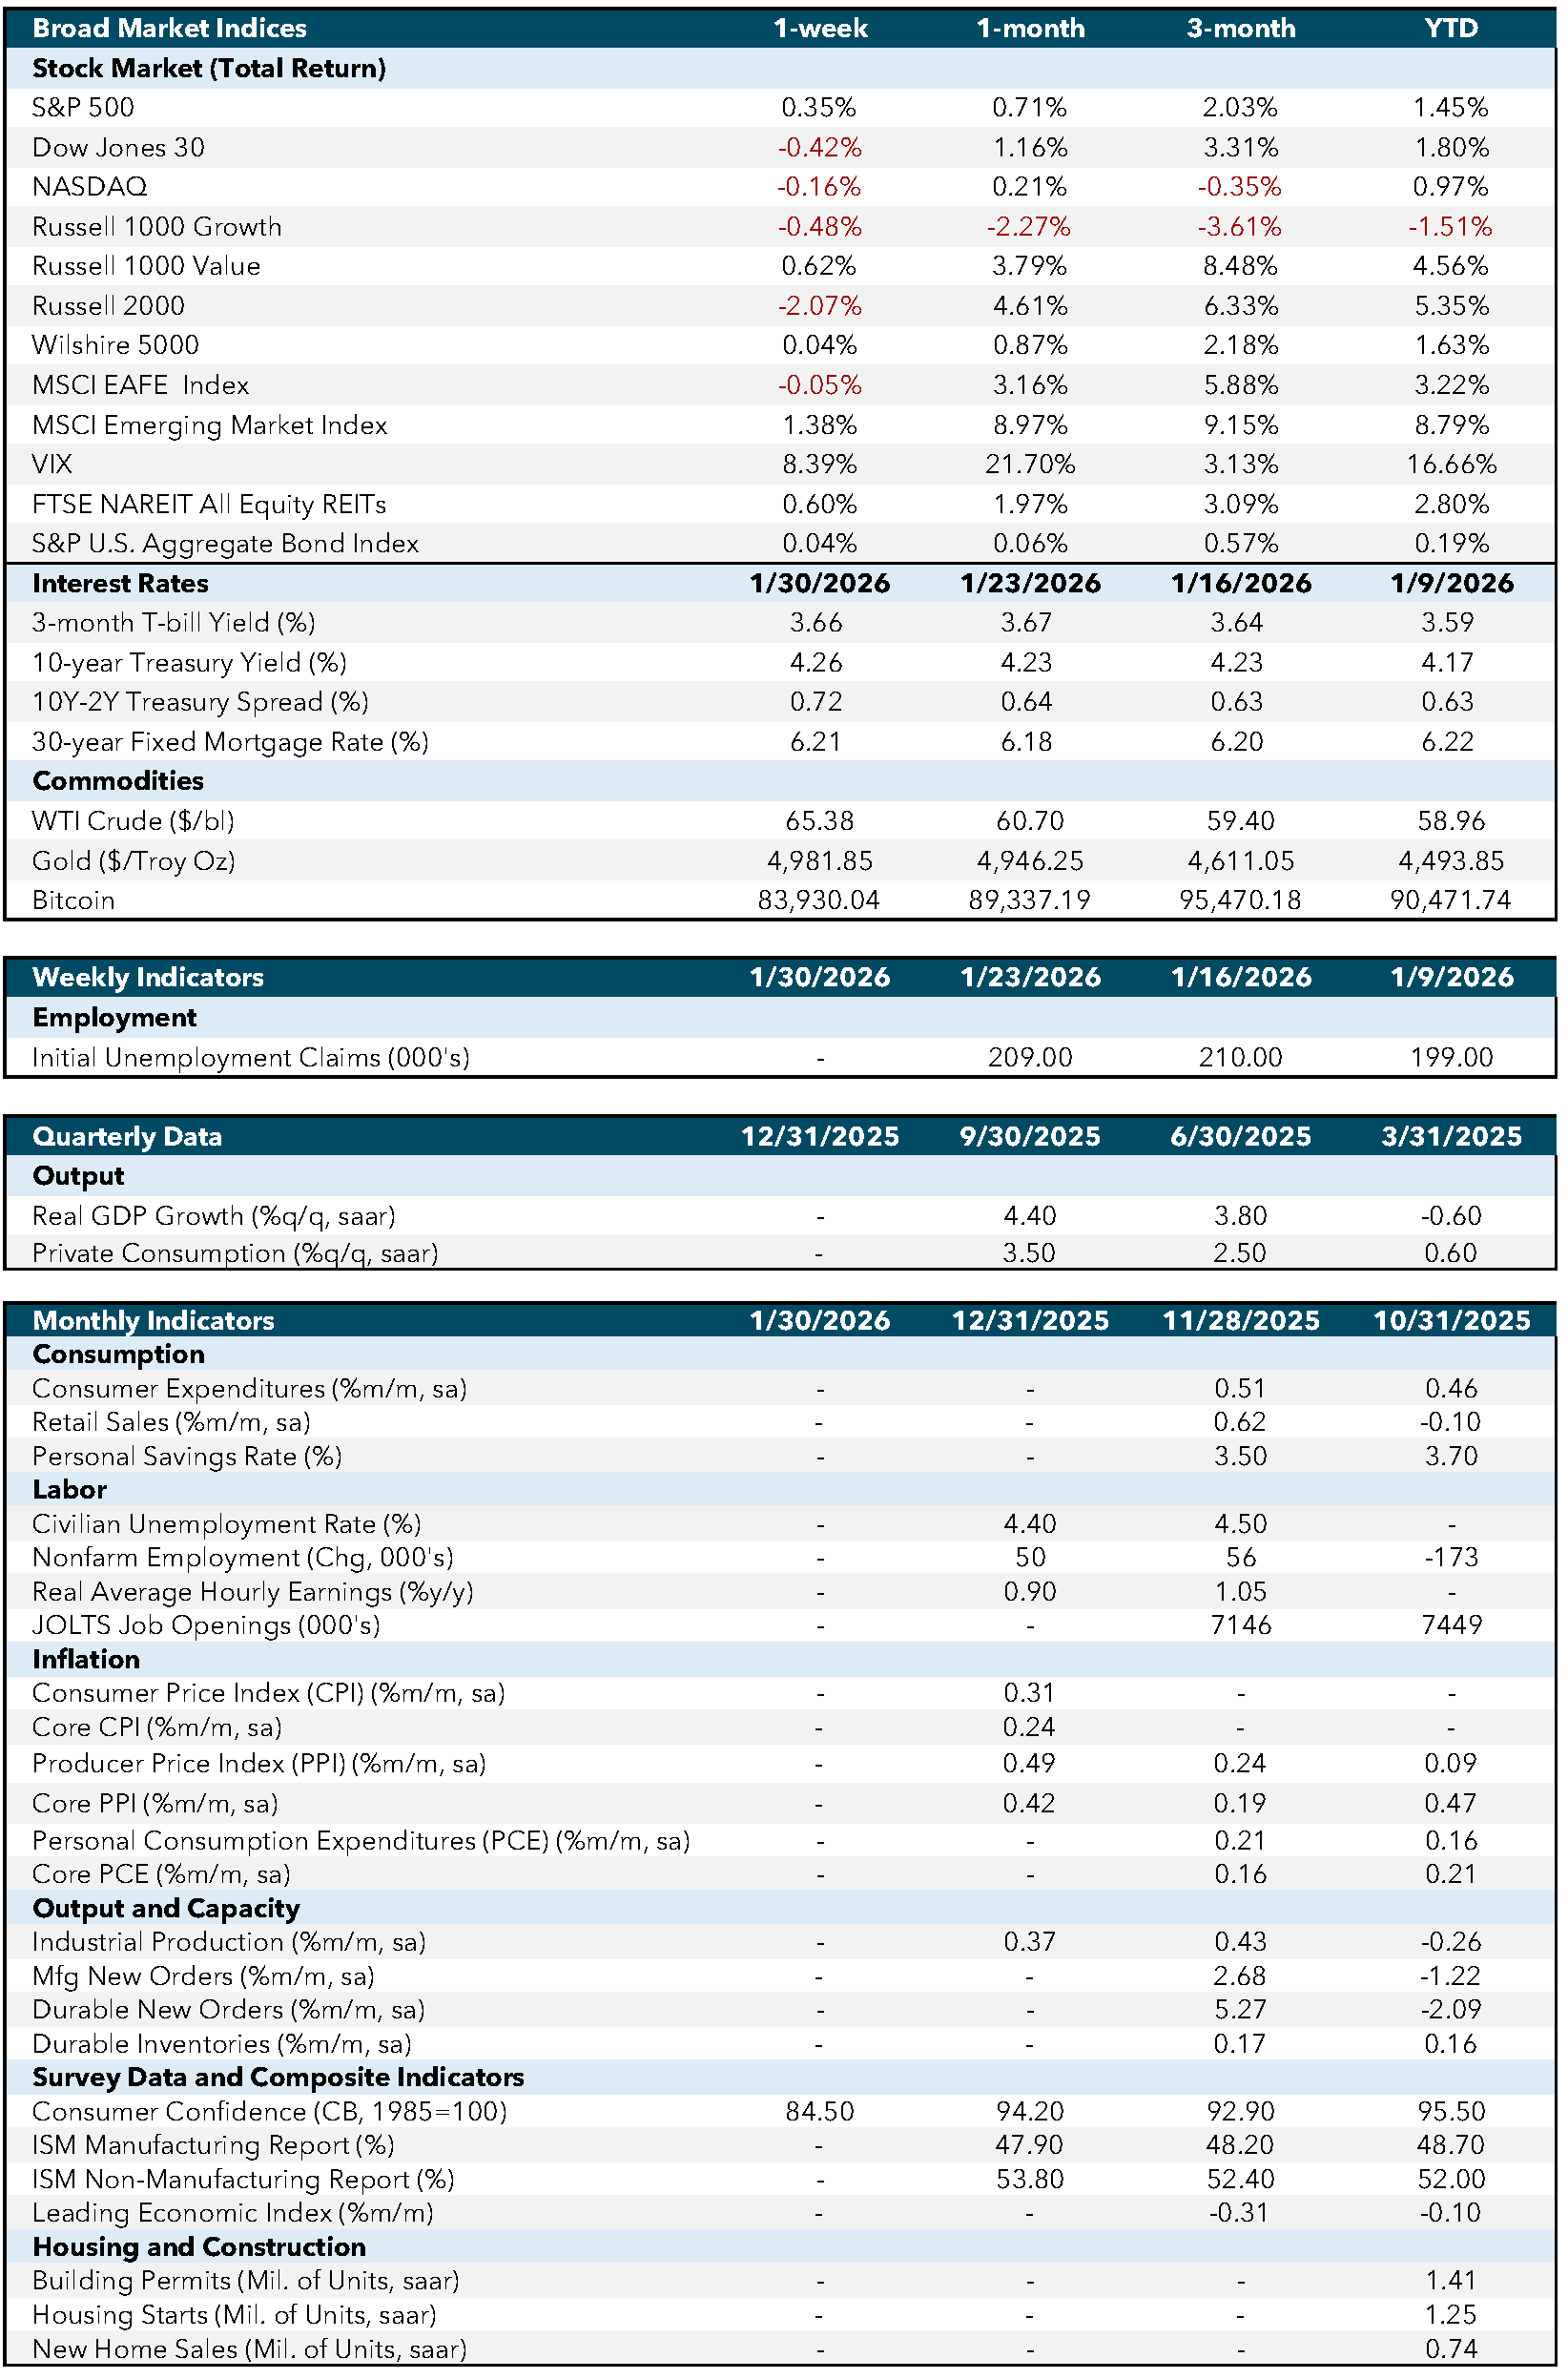
Durable goods orders for November rose 5.3% month-over-month, reflecting a rebound that was heavily influenced by transportation, with orders excluding transportation rising by 0.5% month-over-month. In summary, overall orders rose from the prior month; however, this improvement was largely driven by transportation while other categories were mixed.
In addition, consumer sentiment weakened materially. The Consumer Confidence Index fell to 84.5 in January from 94.2 in December. This suggests households are becoming more cautious, though the survey still reflected ongoing spending capacity for some consumers. Going forward, consumer attitudes may remain sensitive to incoming economic headlines.
The focal point of the week was the January Federal Open Market Committee (FOMC) decision and statement. The Fed held the target range for the federal funds rate at 3.50% to 3.75%. Their statement noted economic activity expanding at a solid pace, while job gains remained low. They highlighted that the unemployment rate is showing some signs of stability, with inflation remaining somewhat elevated. Going forward, the committee is emphasizing data dependence and balancing risks rather than signaling a shift in the policy path.
Late week inflation indicators added further context. Core producer prices in the United States, which exclude food and energy, jumped by 0.7% from the previous month in December 2025, the sharpest increase in five months, and firmly above market expectations of a softer 0.2% increase. Final demand prices for goods, less food and energy, were 0.4% higher, while those for services surged by 0.7%. This suggests that producer-level inflation could remain persistent if services margins continue to run high.
The final major headline of the week was the administration’s announcement that President Trump will nominate Kevin Warsh as the next Fed chair. Looking ahead, investors will increasingly focus on the confirmation process and how leadership transition risk interacts with incoming data.
Economic and Capital Markets Dashboard
Week Ahead…

Investors will take notice of several key U.S. releases over the week ahead. The first major data point arrives with the ISM Manufacturing Purchasing Managers’ Index (PMI), a key measure of factory conditions across production, orders, and employment. This indicator will provide an updated read on whether factory activity is stabilizing after prior mixed signals.
Attention will then shift to the Job Openings and Labor Turnover Survey (JOLTS) report for December, a key measure of labor demand. This indicator will provide clarity on how employers are approaching hiring during the start of the new year. Trends in job openings, quits, and overall turnover may help indicate whether the labor market is loosening further or holding steady.
This week also includes a look at the broader U.S. services economy. The ISM Non-Manufacturing PMI is a mid-week print that measures activity across the non-manufacturing sector. This report will help show whether service-sector momentum is holding up as February begins.
A timely read on layoffs arrives next with Initial Jobless Claims covering the week ending January 31. Recent claims have hovered around 209,000 and this update will offer a real-time indication of labor market steadiness or signs of emerging softening.
The week will end with the January Employment Situation Report. Payroll growth, unemployment figures, participation rates, and wage trends will help outline the state of the labor market entering the new year. As these indicators feed directly into assessments of household strength, this data will carry significant weight for policymakers and market observers.
Economic Indicators:
- CPI: Consumer Price Index measures the average change in prices paid by consumers for goods and services over time. Source: Bureau of Labor Statistics.
- Core CPI: Core Consumer Price Index excludes food and energy prices to provide a clearer picture of long-term inflation trends. Source: Bureau of Labor Statistics.
- PPI: Producer Price Index measures the average change in selling prices received by domestic producers for their output. Source: Bureau of Labor Statistics.
- Core PPI: Core Producer Price Index excludes food and energy prices to provide a clearer picture of long-term inflation trends. Source: Bureau of Labor Statistics.
- PCE: Personal Consumption Expenditures measure the average change in prices paid by consumers for goods and services. Source: Bureau of Economic Analysis.
- Core PCE: Core Personal Consumption Expenditures exclude food and energy prices to provide a clearer picture of long-term inflation trends. Source: Bureau of Economic Analysis.
- Industrial Production: Measures the output of the industrial sector, including manufacturing, mining, and utilities. Source: Federal Reserve.
- Mfg New Orders: Measures the value of new orders placed with manufacturers for durable and non-durable goods. Source: Census Bureau.
- Durable New Orders: Measures the value of new orders placed with manufacturers of durable goods. Source: Census Bureau.
- Durable Inventories: Measures the value of inventories held by manufacturers for durable goods. Source: Census Bureau.
- Consumer Confidence (CB, 1985=100): Measures the degree of optimism that consumers feel about the overall state of the economy and their personal financial situation. Source: Conference Board.
- ISM Manufacturing Report: Measures the economic health of the manufacturing sector based on surveys of purchasing managers. Source: Institute for Supply Management.
- ISM Non-Manufacturing Report: Measures the economic health of the non-manufacturing sector based on surveys of purchasing managers. Source: Institute for Supply Management.
- Leading Economic Index: Measures overall economic activity and predicts future economic trends. Source: Conference Board.
- Building Permits (Mil. of Units, saar): Measures the number of new residential building permits issued. Source: Census Bureau.
- Housing Starts (Mil. of Units, saar): Measures the number of new residential construction projects that have begun. Source: Census Bureau.
- New Home Sales (Mil. of Units, saar): Measures the number of newly constructed homes sold. Source: Census Bureau.
- SA: Seasonally adjusted.
- SAAR: Seasonally adjusted annual rate.
Market Indices & Indicators:
- S&P 500: A market-capitalization-weighted index of 500 leading publicly traded companies in the U.S., widely regarded as one of the best gauges of large U.S. stocks and the stock market overall.
- Dow Jones 30: Also known as the Dow Jones Industrial Average, it tracks the share price performance of 30 large, publicly traded U.S. companies, serving as a barometer of the stock market and economy.
- NASDAQ: The world’s first electronic stock exchange, primarily listing technology giants and operating 29 markets globally.
- Russell 1000 Growth: Measures the performance of large-cap growth segment of the U.S. equity universe, including companies with higher price-to-book ratios and growth metrics.
- Russell 1000 Value: Measures the performance of large-cap value segment of the U.S. equity universe, including companies with lower price-to-book ratios and growth metrics.
- Russell 2000: A market index composed of 2,000 small-cap companies, widely used as a benchmark for small-cap mutual funds.
- Wilshire 5000: A market-capitalization-weighted index capturing the performance of all American stocks actively traded in the U.S., representing the broadest measure of the U.S. stock market.
- MSCI EAFE Index: An equity index capturing large and mid-cap representation across developed markets countries around the world, excluding the U.S. and Canada.
- MSCI Emerging Market Index: Captures large and mid-cap representation across emerging markets countries, covering approximately 85% of the free float-adjusted market capitalization in each country.
- VIX: The CBOE Volatility Index measures the market’s expectations for volatility over the coming 30 days, often referred to as the “fear gauge.”
- FTSE NAREIT All Equity REITs: Measures the performance of all publicly traded equity real estate investment trusts (REITs) listed in the U.S., excluding mortgage REITs.
- S&P U.S. Aggregate Bond Index: Represents the performance of the U.S. investment-grade bond market, including government, corporate, mortgage-backed, and asset-backed securities.
- 3-Month T-bill Yield (%): The yield on U.S. Treasury bills with a maturity of three months, reflecting short-term interest rates.
- 10-Year Treasury Yield (%): The yield on U.S. Treasury bonds with a maturity of ten years, reflecting long-term interest rates.
- 10Y-2Y Treasury Spread (%): The difference between the yields on 10-year and 2-year U.S. Treasury bonds, often used as an indicator of economic expectations.
- WTI Crude ($/bl): The price per barrel of West Texas Intermediate crude oil, a benchmark for U.S. oil prices.
- Gold ($/Troy Oz): The price per troy ounce of gold, a standard measure for gold prices.
- Bitcoin: A decentralized digital currency without a central bank or single administrator, which can be sent from user to user on the peer-to-peer bitcoin network.
This content was developed by Cambridge from sources believed to be reliable. This content is provided for informational purposes only and should not be construed or acted upon as individualized investment advice. It should not be considered a recommendation or solicitation. Information is subject to change. Any forward-looking statements are based on assumptions, may not materialize, and are subject to revision without notice. The information in this material is not intended as tax or legal advice.
Investing involves risk. Depending on the different types of investments there may be varying degrees of risk. Socially responsible investing does not guarantee any amount of success. Clients and prospective clients should be prepared to bear investment loss including loss of original principal. Indices mentioned are unmanaged and cannot be invested into directly. Past performance is not a guarantee of future results.
The Dow Jones Industrial Average (DJIA) is a price-weighted index composed of 30 widely traded blue-chip U.S. common stocks. The S&P 500 is a market-cap weighted index composed of the common stocks of 500 leading companies in leading industries of the U.S. economy. The NASDAQ Composite Index is a market-value weighted index of all common stocks listed on the NASDAQ stock exchange.
Securities offered through Cambridge Investment Research, Inc., a broker-dealer, member FINRA/SIPC, and investment advisory services offered through Cambridge Investment Research Advisors, Inc., a Registered Investment Adviser. Both are wholly-owned subsidiaries of Cambridge Investment Group, Inc. V.CIR.0226-0393