Weekly Market Commentary
January 26th, 2026
Week in Review…
Economic data released this week continued to show a U.S. economy growing at a steady, though gradually moderating, pace. Real gross domestic product (GDP) for the most recent quarter was revised higher to an annualized 4.4%, reflecting strong consumer spending and resilient business investment. Personal consumption remained the primary contributor to growth, while government spending also provided support. Despite the strong backward-looking print, forward indicators suggest growth is likely to cool as restrictive monetary policy continues to work through the economy.
Labor market conditions remained firm. Initial jobless claims for the week came in at 200,000, up slightly from the prior week but still near historically low levels. The four-week moving average held close to 205,000, reinforcing the view that layoffs remain limited and that employers continue to retain workers amid a tight labor market. These figures remain consistent with stable income growth and ongoing labor market resilience.
Inflation data was broadly in line with expectations. Headline Personal Consumption Expenditures (PCE) inflation rose 0.2% month-over-month and 2.8% year-over-year, while core PCE also increased 0.2% on the month and 2.8% year-over-year. Services inflation remained sticky, offsetting continued easing in goods prices. The data suggest inflation progress has slowed, supporting expectations that the Federal Reserve will remain cautious on the timing of policy easing.
Business sentiment softened modestly. Manufacturing Purchasing Managers’ Index (PMI) registered 51.9, while Services PMI came in at 52.5, both remaining in expansion territory but down from prior highs. The readings point to continued growth in private-sector activity, though at a more moderate pace entering the new year.
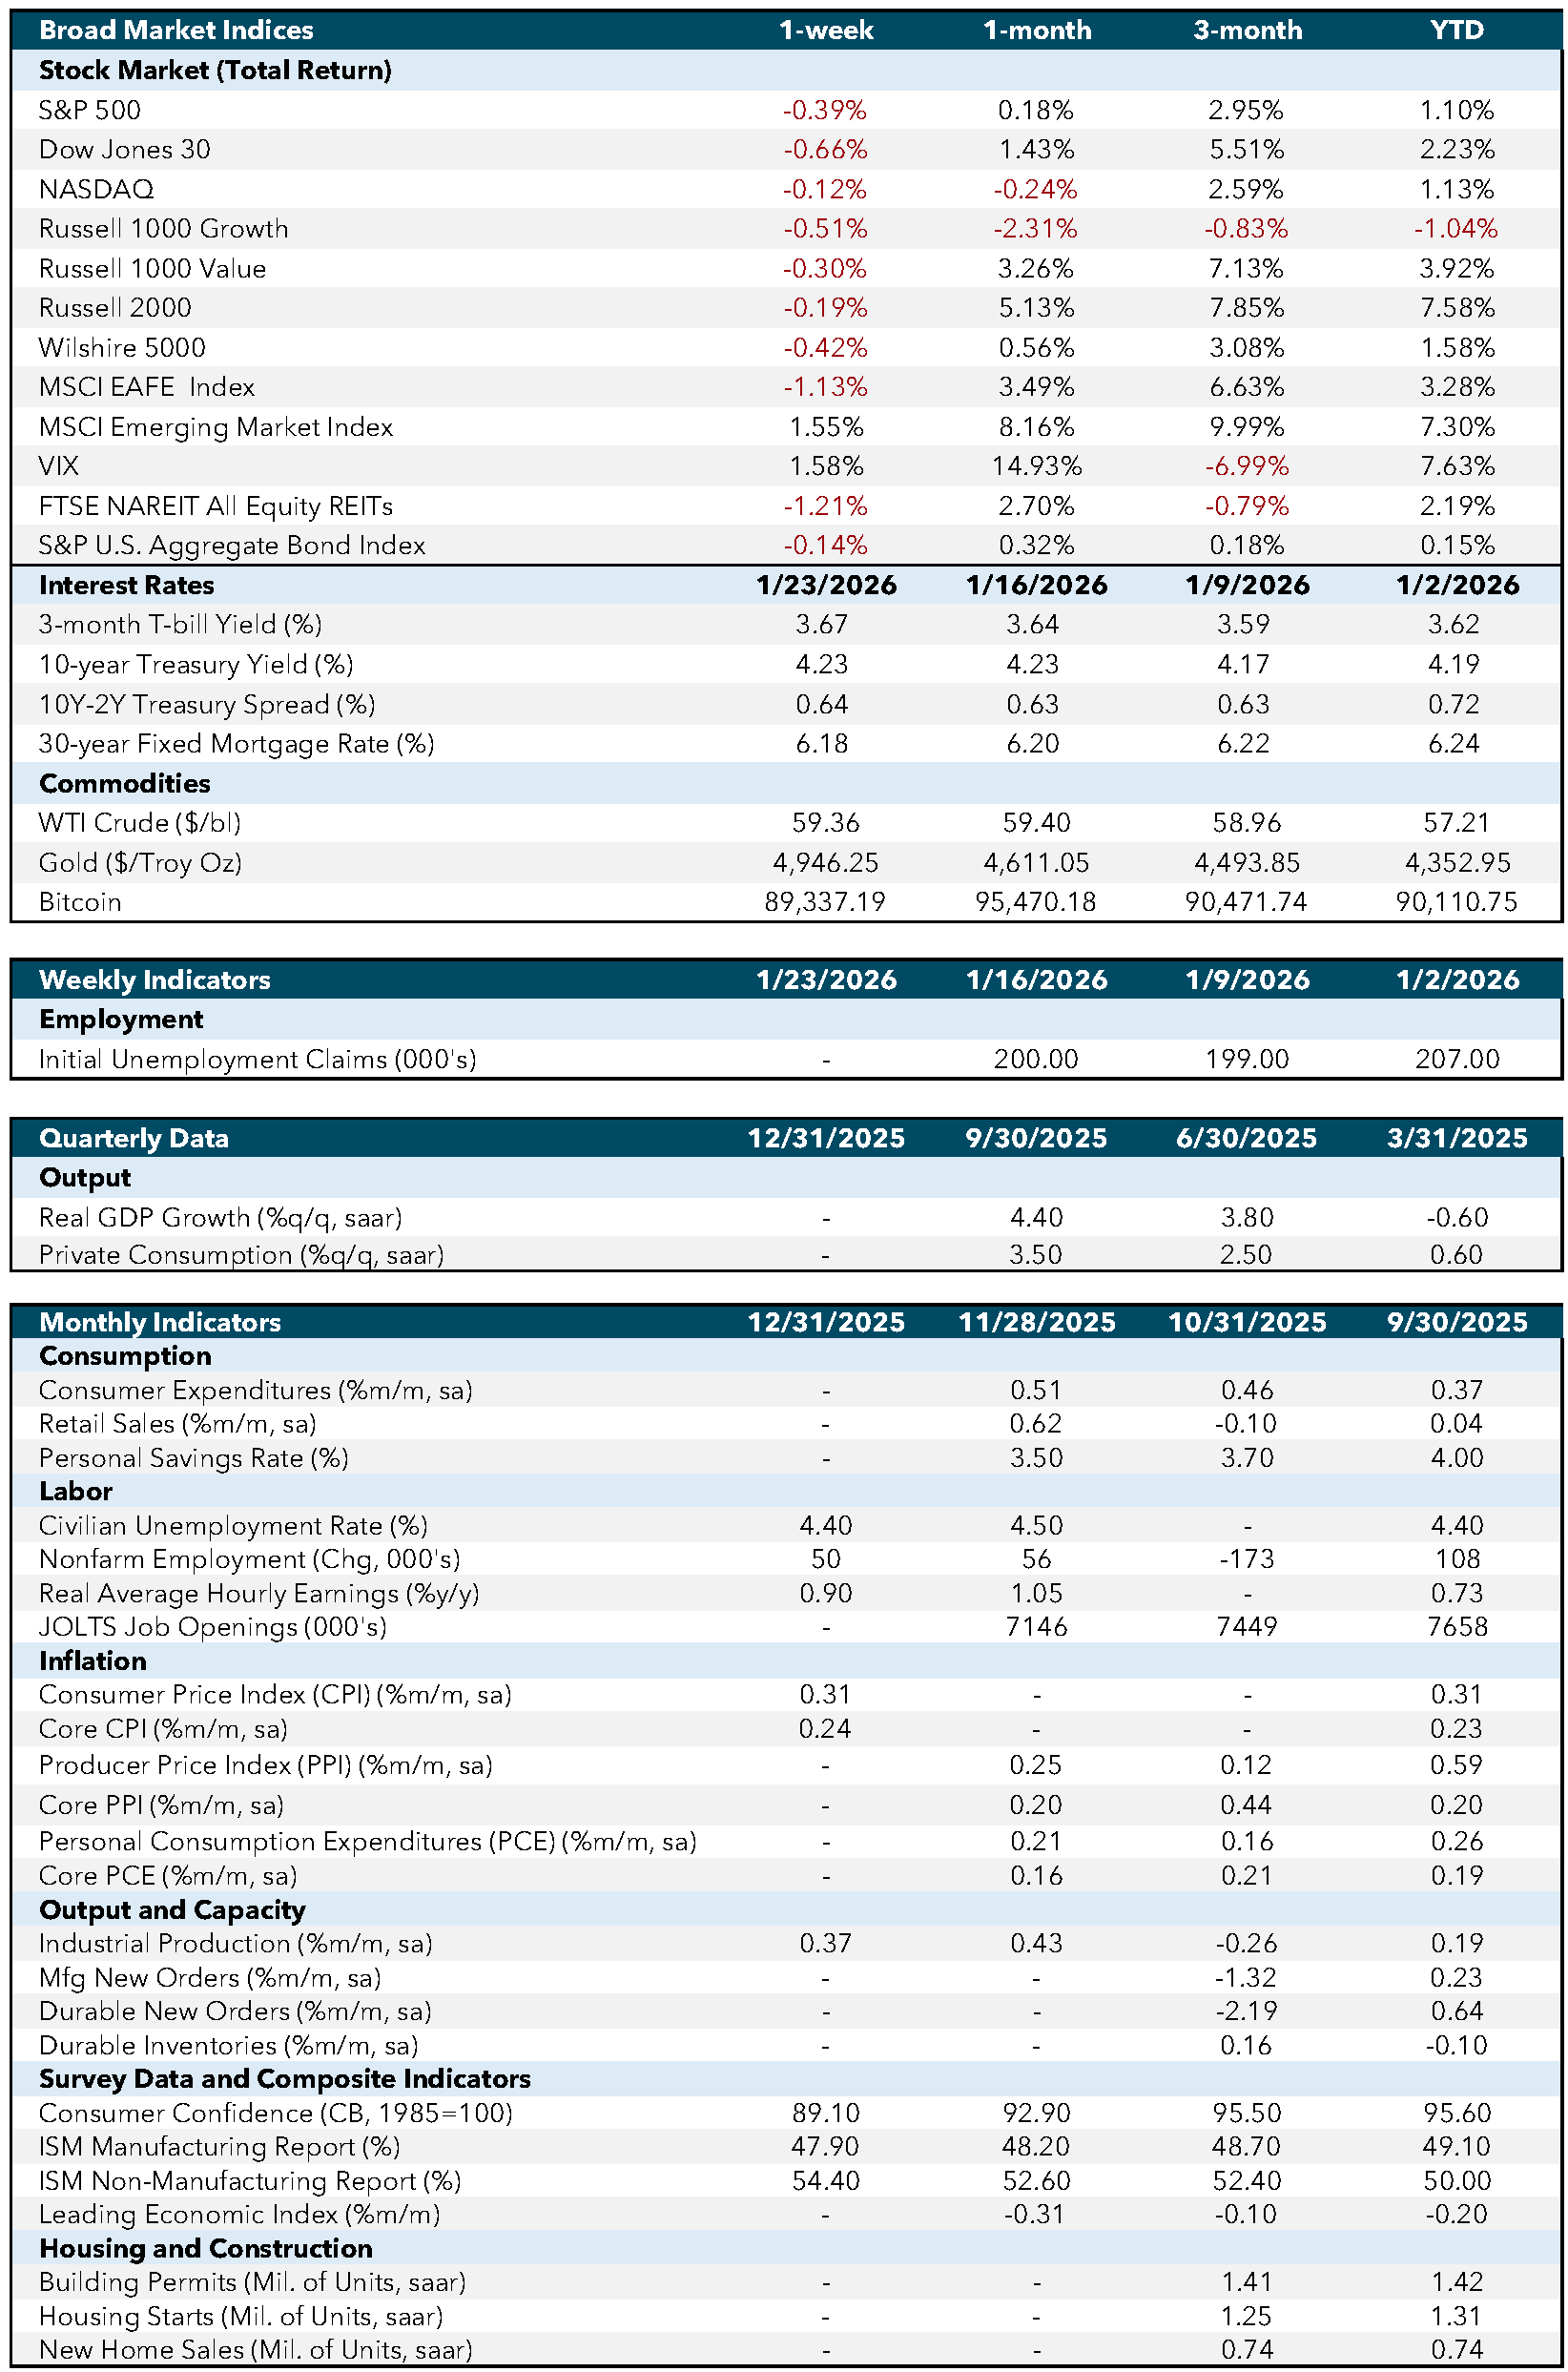
Economic and Capital Markets Dashboard
Week Ahead…

The upcoming week features several important economic releases that will help shape market sentiment. Durable goods orders, due early in the week, will offer insight into business investment and demand for long-lasting manufactured goods. Investors often view this report as a signal of corporate confidence and industrial momentum, with implications for cyclical sectors and broader growth expectations.
Also early in the week, Consumer Confidence data will provide a snapshot of household sentiment regarding economic conditions and spending prospects. Because consumer activity is a key driver of economic growth, shifts in confidence can influence equity markets and interest rate expectations, particularly in consumer-focused sectors.
Mid-week attention will center on the Federal Reserve, with the release of the Federal Open Market Committee (FOMC) statement and interest rate decision. Even in the absence of a policy change, markets will closely analyze the Fed’s language for clues on inflation, economic risks, and the future path of monetary policy. Subtle changes in tone can have outsized effects on bond yields, the U.S. dollar, and equity volatility.
Later in the week, Producer Price Index (PPI) data will be released, offering insight into inflation pressures at the wholesale level. Investors will assess whether input costs are easing or persisting, as this can influence expectations for future consumer inflation and Fed policy.
The week concludes with the Chicago PMI, a regional manufacturing survey that serves as an early indicator of broader factory activity. The report can shape views on manufacturing momentum heading into the next month.
Economic Indicators:
- CPI: Consumer Price Index measures the average change in prices paid by consumers for goods and services over time. Source: Bureau of Labor Statistics.
- Core CPI: Core Consumer Price Index excludes food and energy prices to provide a clearer picture of long-term inflation trends. Source: Bureau of Labor Statistics.
- PPI: Producer Price Index measures the average change in selling prices received by domestic producers for their output. Source: Bureau of Labor Statistics.
- Core PPI: Core Producer Price Index excludes food and energy prices to provide a clearer picture of long-term inflation trends. Source: Bureau of Labor Statistics.
- PCE: Personal Consumption Expenditures measure the average change in prices paid by consumers for goods and services. Source: Bureau of Economic Analysis.
- Core PCE: Core Personal Consumption Expenditures exclude food and energy prices to provide a clearer picture of long-term inflation trends. Source: Bureau of Economic Analysis.
- Industrial Production: Measures the output of the industrial sector, including manufacturing, mining, and utilities. Source: Federal Reserve.
- Mfg New Orders: Measures the value of new orders placed with manufacturers for durable and non-durable goods. Source: Census Bureau.
- Durable New Orders: Measures the value of new orders placed with manufacturers of durable goods. Source: Census Bureau.
- Durable Inventories: Measures the value of inventories held by manufacturers for durable goods. Source: Census Bureau.
- Consumer Confidence (CB, 1985=100): Measures the degree of optimism that consumers feel about the overall state of the economy and their personal financial situation. Source: Conference Board.
- ISM Manufacturing Report: Measures the economic health of the manufacturing sector based on surveys of purchasing managers. Source: Institute for Supply Management.
- ISM Non-Manufacturing Report: Measures the economic health of the non-manufacturing sector based on surveys of purchasing managers. Source: Institute for Supply Management.
- Leading Economic Index: Measures overall economic activity and predicts future economic trends. Source: Conference Board.
- Building Permits (Mil. of Units, saar): Measures the number of new residential building permits issued. Source: Census Bureau.
- Housing Starts (Mil. of Units, saar): Measures the number of new residential construction projects that have begun. Source: Census Bureau.
- New Home Sales (Mil. of Units, saar): Measures the number of newly constructed homes sold. Source: Census Bureau.
- SA: Seasonally adjusted.
- SAAR: Seasonally adjusted annual rate.
Market Indices & Indicators:
- S&P 500: A market-capitalization-weighted index of 500 leading publicly traded companies in the U.S., widely regarded as one of the best gauges of large U.S. stocks and the stock market overall.
- Dow Jones 30: Also known as the Dow Jones Industrial Average, it tracks the share price performance of 30 large, publicly traded U.S. companies, serving as a barometer of the stock market and economy.
- NASDAQ: The world’s first electronic stock exchange, primarily listing technology giants and operating 29 markets globally.
- Russell 1000 Growth: Measures the performance of large-cap growth segment of the U.S. equity universe, including companies with higher price-to-book ratios and growth metrics.
- Russell 1000 Value: Measures the performance of large-cap value segment of the U.S. equity universe, including companies with lower price-to-book ratios and growth metrics.
- Russell 2000: A market index composed of 2,000 small-cap companies, widely used as a benchmark for small-cap mutual funds.
- Wilshire 5000: A market-capitalization-weighted index capturing the performance of all American stocks actively traded in the U.S., representing the broadest measure of the U.S. stock market.
- MSCI EAFE Index: An equity index capturing large and mid-cap representation across developed markets countries around the world, excluding the U.S. and Canada.
- MSCI Emerging Market Index: Captures large and mid-cap representation across emerging markets countries, covering approximately 85% of the free float-adjusted market capitalization in each country.
- VIX: The CBOE Volatility Index measures the market’s expectations for volatility over the coming 30 days, often referred to as the “fear gauge.”
- FTSE NAREIT All Equity REITs: Measures the performance of all publicly traded equity real estate investment trusts (REITs) listed in the U.S., excluding mortgage REITs.
- S&P U.S. Aggregate Bond Index: Represents the performance of the U.S. investment-grade bond market, including government, corporate, mortgage-backed, and asset-backed securities.
- 3-Month T-bill Yield (%): The yield on U.S. Treasury bills with a maturity of three months, reflecting short-term interest rates.
- 10-Year Treasury Yield (%): The yield on U.S. Treasury bonds with a maturity of ten years, reflecting long-term interest rates.
- 10Y-2Y Treasury Spread (%): The difference between the yields on 10-year and 2-year U.S. Treasury bonds, often used as an indicator of economic expectations.
- WTI Crude ($/bl): The price per barrel of West Texas Intermediate crude oil, a benchmark for U.S. oil prices.
- Gold ($/Troy Oz): The price per troy ounce of gold, a standard measure for gold prices.
- Bitcoin: A decentralized digital currency without a central bank or single administrator, which can be sent from user to user on the peer-to-peer bitcoin network.
This content was developed by Cambridge from sources believed to be reliable. This content is provided for informational purposes only and should not be construed or acted upon as individualized investment advice. It should not be considered a recommendation or solicitation. Information is subject to change. Any forward-looking statements are based on assumptions, may not materialize, and are subject to revision without notice. The information in this material is not intended as tax or legal advice.
Investing involves risk. Depending on the different types of investments there may be varying degrees of risk. Socially responsible investing does not guarantee any amount of success. Clients and prospective clients should be prepared to bear investment loss including loss of original principal. Indices mentioned are unmanaged and cannot be invested into directly. Past performance is not a guarantee of future results.
The Dow Jones Industrial Average (DJIA) is a price-weighted index composed of 30 widely traded blue-chip U.S. common stocks. The S&P 500 is a market-cap weighted index composed of the common stocks of 500 leading companies in leading industries of the U.S. economy. The NASDAQ Composite Index is a market-value weighted index of all common stocks listed on the NASDAQ stock exchange.
Securities offered through Cambridge Investment Research, Inc., a broker-dealer, member FINRA/SIPC, and investment advisory services offered through Cambridge Investment Research Advisors, Inc., a Registered Investment Adviser. Both are wholly-owned subsidiaries of Cambridge Investment Group, Inc. V.CIR.0126-0309